‘7’
FAMILY COURTS ACT ENFORCED IN GUJARAT
The Family Courts Act, 1984 has been introduced in the State of Gujarat. This Act has come into force with effect from January, 2000.
A Notification to this effect has been issued by the Government of India under Sub-Section (3) of Section 1 of the Family Courts Act, 1984.
The enforcement of the Family Courts Act in Gujarat would enable the State Government there to set up Family Courts in order to resolve disputes over the family matters.
'24'
EXPANSION PROGRAMME - DEPARTMENTS OF TELECOMMUNICATIONS/TELECOM SERVICES
The following are the details of the expansion programmes undertaken by the Department of Telecom Services in the last three months :
QUICK ESTIMATES OF NATIONAL INCOME, CONSUMPTION EXPENDITURE, SAVING AND CAPITAL FORMATION, 1998-99
The Central Statistical Organisation(CSO), Ministry of Statistics & Programme Implementation has released the Quick estimates of national income, consumption expenditure, saving and capital formation for the financial year 1998-99. The salient features of the estimates are indicated below:
GROSS DOMESTIC PRODUCT AND NATIONAL INCOME
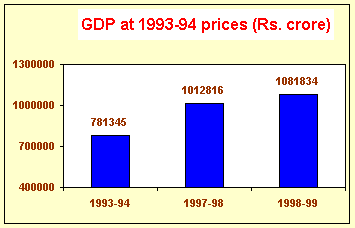
Gross domestic product (GDP) at factor cost at constant (1993-94) prices in 1998-99 is estimated at Rs. 1,081,834 crore as against Rs. 1,012,816 crore in 1997-98 registering a growth of 6.8 per cent during the year as against the growth rate of 5.0 per cent during the previous year. At current prices, GDP in 1998-99 is estimated at Rs.1,612,383 crore as against Rs.1,384,446 crore in 1997-98, showing an increase of 16.5 per cent during the year.
At constant (1993-94) prices the national income (i.e. net national product at factor cost) in 1998-99 is estimated at Rs. 949,525 crore as against Rs. 889,102 crore in 1997-98 showing a rise of 6.8 per cent during the year. At current prices, the national income in 1998-99 is estimated at Rs. 1,431,527 crore as compared to Rs.1,220,716 crore in 1997-98, showing a rise of 17.3 per cent during the year.
The growth rate of 6.8 per cent in GDP during 1998-99 has been mainly due to high growth in agriculture, electricity, construction, trade, hotels and restaurants, communication, banking and insurance, real estate & business services and community, social & personal services sectors.
PER CAPITA NATIONAL INCOME
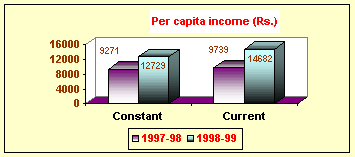
The per capita income (per capita net national product at factor cost) in real terms i.e. at 1993-94 prices is estimated at Rs. 9,739 for 1998-99 as against Rs. 9,271 for 1997-98, registering an increase of 5.0 per cent during the year. The per capita income at current prices is estimated at Rs. 14,682 in 1998-99 as against Rs. 12,729 for the previous year depicting a growth of 15.3 per cent .
CONSUMPTION EXPENDITURE, SAVING AND CAPITAL FORMATION
In order to derive the GDP at market prices, the GDP at factor cost is adjusted by adding indirect taxes net of subsidies. As various components of expenditure on gross domestic product, namely, consumption expenditure and capital formation, are normally measured at market prices, the discussion in the following paragraphs is in terms of market prices only.
PRIVATE FINAL CONSUMPTION EXPENDITURE
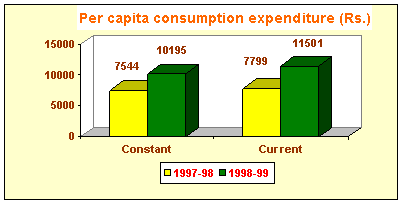
Private final consumption expenditure (PFCE) in the domestic market at current prices works out to Rs. 1,121,340 crore in 1998-99 as against Rs. 977,684 crore in 1997-98. At constant (1993-94) prices PFCE works out to Rs. 760,354 crore in 1998-99 as against Rs. 723,432 crore in 1997-98. The per capita PFCE in 1998-99 works out to Rs. 11,501 at current prices and Rs. 7,799 at constant (1993-94) prices as against Rs. 10,195 and Rs. 7,544 respectively in 1997-98. The expenditure on almost all items, both at current and constant prices, has increased in 1998-99 as compared to that of the previous year. Shares of various groups have, however, remained almost the same during 1998-99.
DOMESTIC SAVING
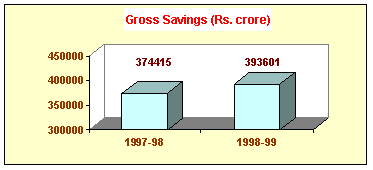
Gross domestic saving (GDS) at current prices in 1998-99 is estimated at Rs. 393,601 crore as against Rs. 374,415 crore in 1997-98, constituting 22.3 per cent of GDP at market prices as against 24.7 per cent in the previous year. The rise in GDS has been contributed mainly by the household sector. Private corporate sector also shows a small rise. However, there is a steep fall in the saving of the public sector. In respect of the household sector, the financial saving has gone up in 1998-99 from Rs. 157,526 crore to Rs. 192,261 crore, and the saving in physical assets from Rs. 131,024 crore to Rs. 133,195 crore. Saving of private corporate sector has gone up by 4.3 per cent from Rs.64,786 crore in 1997-98 to Rs. 67,573 crore in 1998-99. The saving of the public sector showed a decline of 97.3 per cent from Rs. 21,079 crore in 1997-98 to Rs. 572 crore in 1998-99. The decrease in the public sector saving is solely due to decrease in the saving of government administrative departments from (-) Rs. 40,449 crore in 1997-98 to (-) Rs.71,939 crore in 1998-99. The net domestic saving has correspondingly gone up from Rs. 223,890 crore in 1997-98 to Rs. 227,712 crore in 1998-99 and constitutes 16.4 per cent of net domestic product at market prices in 1997-98 and 14.3 per cent in 1998-99. As in the case of gross saving, the net saving of the household sector has also gone up by 14.4 per cent from Rs. 237,575 crore in 1997-98 to Rs. 271,793 crore in 1998-99. However, the net saving of the private corporate sector declined by 15.2 per cent from Rs. 25,911 crore in 1997-98 to Rs. 21,963 crore in 1998-99. The net saving of the public sector has decreased substantially from (-) Rs. 39,596 crore in 1997-98 to (-) Rs.66,044 crore in 1998-99.
CAPITAL FORMATION
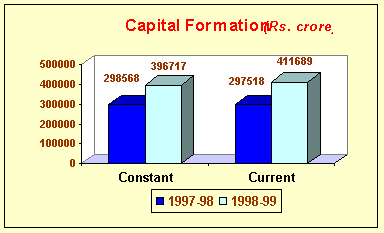
Gross capital formation at current prices has increased from Rs. 396,717 crore in 1997-98 to Rs. 411,689 crore in 1998-99 and at constant (1993-94) prices, it decreased from Rs. 298,568 crore in 1997-98 to Rs. 297,518 crore in 1998-99. The rate of gross capital formation at current prices has declined from 26.2 per cent in 1997-98 to 23.4 per cent in 1998-99. The rates of capital formation in 1997-98 and 1998-99 are higher than the rate of saving because of the positive net capital inflow from abroad which was Rs. 22,302 crore in 1997-98 and Rs. 18,088 crore in 1998-99. The net capital inflow from abroad for the two years forms 1.5 and 1.0 per cent of GDP at market prices respectively. The rate of gross capital formation at constant (1993-94) prices also declined from 26.9 per cent in 1997-98 to 25.1 per cent in 1998-99. The rate of net capital formation at current prices in 1998-99 was 15.4 per cent as compared to 18.0 per cent in 1997-98.
Within the gross capital formation at current prices, the gross fixed capital formation amounted to Rs. 378,008 crore in 1998-99 as against Rs. 343,912 crore in 1997-98, thus showing an increase of 9.9 per cent over 1997-98. At current prices, the gross fixed capital formation of the public sector increased by 16.4 per cent from Rs. 98,589 crore in 1997-98 to Rs. 114,796 crore in 1998-99; and that of private corporate sector by 10.7 per cent from Rs. 120,907 crore in 1997-98 to Rs. 133,832 crore in 1998-99, and that of the household sector by 4.0 per cent from Rs. 124,416 crore in 1997-98 to Rs. 129,380 crore in 1998-99.
The change in stocks of inventories, measured as additions to stocks, decreased substantially during 1998-99. At current prices it decreased from Rs. 10,087 crore in 1997-98 to Rs. 6,510 crore in 1998-99. The decrease is observed in public sector from Rs. 2,519 crore to Rs. 1,366 crore and household sector from Rs. 6,608 crore to Rs. 3,815 crore whereas in the private corporate sector it has increased from Rs. 960 crore in 1997-98 to Rs. 1,329 crore in 1998-99 .
The estimates of National Product, Consumption Expenditure, Saving and Capital Formation at aggregate and per capita levels for the years 1993-94 and 1995-96 to 1998-99 are presented in Statement 1 and the detailed estimates at industry/item level in Statements 2 to 10.
STATEMENT 1: NATIONAL PRODUCT, CONSUMPTION EXPENDITURE, SAVING AND CAPITAL FORMATION |
|||||||
at current prices |
|||||||
1993-94 |
1997-98@ |
1998-99* |
1997-98@ |
1998-99* |
|||
A. ESTIMATES AT AGGREGATE LEVEL |
|||||||
1 |
NATIONAL PRODUCT (Rs. crore) |
||||||
769,265 |
1,371,241 |
1,597,416 |
1.1 |
Gross national product (GNP) |
1,002,500 |
1,070,665 |
|
(12.0) |
(16.5) |
at factor cost |
(5.1) |
(6.8) |
|||
685,912 |
1,220,716 |
1,431,527 |
1.2 |
Net national product (NNP) at factor cost, i.e., |
889,102 |
949,525 |
|
(12.0) |
(17.3) |
National income |
(4.9) |
(6.8) |
|||
847,140 |
1,502,441 |
1,747,642 |
1.3 |
GNP at market prices |
1,100,068 |
1,174,230 |
|
(11.4) |
(16.3) |
(4.7) |
(6.7) |
||||
763,787 |
1,351,916 |
1,581,753 |
1.4 |
NNP at market prices |
986,670 |
1,053,090 |
|
(11.3) |
(17.0) |
(4.4) |
(6.7) |
||||
2 |
DOMESTIC PRODUCT (Rs. crore) |
||||||
781,345 |
1,384,446 |
1,612,383 |
2.1 |
Gross domestic product (GDP) |
1,012,816 |
1,081,834 |
|
(11.9) |
(16.5) |
at factor cost |
(5.0) |
(6.8) |
|||
697,992 |
1,233,921 |
1,446,494 |
2.2 |
Net domestic product (NDP) |
899,418 |
960,694 |
|
(11.9) |
(17.2) |
at factor cost |
(4.8) |
(6.8) |
|||
859,220 |
1,515,646 |
1,762,609 |
2.3 |
GDP at market prices |
1,110,384 |
1,185,399 |
|
(11.3) |
(16.3) |
(4.6) |
(6.8) |
||||
775,867 |
1,365,121 |
1,596,720 |
2.4 |
NDP at market prices |
996,986 |
1,064,259 |
|
(11.2) |
(17.0) |
(4.3) |
(6.7) |
||||
3 |
DISPOSABLE INCOME @@ (Rs. crore) |
||||||
780,301 |
1,395,680 |
1,624,994 |
3.1 |
Net national disposable income |
|||
(10.9) |
(16.4) |
||||||
707,692 |
1,246,182 |
1,462,564 |
3.2 |
Personal disposable income |
|||
(11.0) |
(17.4) |
||||||
4 |
CONSUMPTION EXPENDITURE (Rs. crore) |
||||||
577,402 |
977,684 |
1,121,340 |
4.1 |
Private final consumption expenditure |
723,432 |
760,354 |
|
(8.7) |
(14.7) |
(PFCE) in the domestic market |
(2.6) |
(5.1) |
|||
97,725 |
171,522 |
216,356 |
4.2 |
Government final consumption |
123,656 |
141,563 |
|
(17.8) |
(26.1) |
expenditure(GFCE) |
(10.6) |
(14.5) |
|||
CONTD.... |
|||||||
-5- |
|||||||
STATEMENT 1 CONCLD. |
|||||||
at current prices |
|||||||
1993-94 |
1997-98@ |
1998-99* |
1997-98@ |
1998-99* |
|||
5 |
DOMESTIC SAVING @@ |
||||||
5.1 |
Total (Rs. crore) |
||||||
193,621 |
374,415 |
393,601 |
5.1.1 Gross |
||||
(17.9) |
(5.1) |
||||||
110,268 |
223,890 |
227,712 |
5.1.2 Net |
||||
(22.4) |
(1.7) |
||||||
5.2 |
Rates** (per cent) |
||||||
22.5 |
24.7 |
22.3 |
5.2.1 Gross |
||||
14.2 |
16.4 |
14.3 |
5.2.2 Net |
||||
6 |
CAPITAL FORMATION |
||||||
6.1 |
Total (Rs. crore) |
||||||
198,412 |
396,717 |
411,689 |
6.1.1 Gross |
298,568 |
297,518 |
||
(18.3) |
(3.8) |
(13.1) |
(-0.4) |
||||
115,059 |
246,192 |
245,800 |
6.1.2 Net |
185,170 |
176,378 |
||
(22.7) |
(-0.2) |
(17.4) |
(-4.7) |
||||
6.2 |
Rates** (per cent) |
||||||
23.1 |
26.2 |
23.4 |
6.2.1 Gross |
26.9 |
25.1 |
||
14.8 |
18.0 |
15.4 |
6.2.2 Net |
18.6 |
16.6 |
||
B. ESTIMATES AT PER CAPITA LEVEL |
|||||||
891 |
959 |
975 |
Population *** (in million) |
959 |
975 |
||
(1.7) |
(1.7) |
(1.7) |
(1.7) |
||||
1 |
INCOME (Rs.) |
||||||
7,698 |
12,729 |
14,682 |
1.1 |
Per capita NNP at factor cost |
9,271 |
9,739 |
|
(10.2) |
(15.3) |
(per capita national income) |
(3.2) |
(5.0) |
|||
7,943 |
12,995 |
15,001 |
1.2 |
Per capita personal |
|||
(9.2) |
(15.4) |
disposable income |
|||||
2 |
CONSUMPTION EXPENDITURE (Rs.) |
||||||
6,480 |
10,195 |
11,501 |
Per capita PFCE in |
7,544 |
7,799 |
||
(6.9) |
(12.8) |
the domestic market |
(0.9) |
(3.4) |
|||
N.B. Figures within parentheses indicate percentage change over the previous year |
|||||||
@ Provisional estimates |
|||||||
@@ The estimates are prepared only at current prices |
|||||||
* Quick estimates |
|||||||
** As per cent of domestic product at market prices |
|||||||
*** Estimates for mid financial year (as on 1st October) |
|||||||
STATEMENT 2: PRICE AND QUANTUM INDICES (1993-94 = 100) |
|||
item |
1997-98@ |
1998-99* |
|
I Price indices |
|||
A. derived from national accounts** |
|||
1. net domestic product |
137.2 |
150.6 |
|
1.1 agriculture |
142.1 |
160.8 |
|
1.2 mining & quarrying |
128.5 |
128.5 |
|
1.3 manufacturing |
128.4 |
137.4 |
|
1.4 electricity, gas & water supply |
130.6 |
136.1 |
|
1.5 others |
137.9 |
150.4 |
|
2. private final consumption expenditure |
135.1 |
147.5 |
|
in domestic market |
|||
3. gross capital formation |
132.9 |
138.4 |
|
3.1 construction |
141.4 |
150.7 |
|
3.2 machinery & equipment |
126.5 |
129.0 |
|
B. directly available |
|||
4. wholesale prices (all commodities) *** |
133.1 |
142.2 |
|
4.1 primary articles (food & non-food |
135.3 |
151.1 |
|
articles & minerals) |
|||
4.2 manufactured products |
130.6 |
136.5 |
|
5. consumer prices *** |
|||
5.1 agricultural labourers |
135.6 |
150.4 |
|
5.2 industrial workers |
141.9 |
160.5 |
|
5.3 urban non-manual employees |
139.8 |
156.0 |
|
II Quantum indices |
|||
A. derived from national accounts** |
|||
6. net domestic product |
128.9 |
137.6 |
|
6.1 agriculture |
112.3 |
121.2 |
|
6.2 mining & quarrying |
127.9 |
127.1 |
|
6.3 manufacturing |
136.8 |
138.6 |
|
6.4 electricity, gas & water supply |
141.3 |
156.1 |
|
6.5 others |
136.0 |
147.0 |
|
B. directly available |
|||
7. index of agricultural production*** |
105.4 |
113.4 |
|
8. index of industrial production |
137.6 |
143.1 |
|
8.1 mining & quarrying |
122.4 |
120.3 |
|
8.2 manufacturing |
140.6 |
146.7 |
|
8.3 electricity |
130.0 |
138.4 |
|
@ provisional estimates *** indices are available with base other than |
|||
* quick estimates 1993-94 and these have been converted |
|||
** implicit to 1993-94= 100 |
|||
STATEMENT 3.1: GROSS DOMESTIC PRODUCT AT FACTOR COST BY ECONOMIC ACTIVITY |
|||||||||
(Rs. crore) |
|||||||||
at current prices |
industry |
at 1993-94 prices |
|||||||
1993-94 |
1997-98@ |
1998-99* |
1997-98@ |
1998-99* |
|||||
241,967 |
387,445 |
469,340 |
1 |
agriculture, forestry & fishing |
270,791 |
290,181 |
|||
221,834 |
352,753 |
428,680 |
1.1 |
agriculture |
248,173 |
267,079 |
|||
11,454 |
15,137 |
18,437 |
1.2 |
forestry & logging |
12,077 |
12,402 |
|||
8,679 |
19,555 |
22,223 |
1.3 |
fishing |
10,541 |
10,700 |
|||
#### |
32,933 |
33,249 |
2 |
mining & quarrying |
25,360 |
25,234 |
|||
#### |
230,152 |
250,905 |
3 |
manufacturing |
179,162 |
##### |
|||
81,873 |
151,884 |
165,725 |
3.1 |
registered |
119,714 |
124,360 |
|||
43,620 |
78,268 |
85,180 |
3.2 |
unregistered |
59,448 |
61,334 |
|||
#### |
33,604 |
38,066 |
4 |
electricity, gas & water supply |
25,041 |
27,025 |
|||
#### |
78,447 |
92,239 |
5 |
construction |
51,622 |
54,550 |
|||
#### |
190,465 |
213,422 |
6 |
trade, hotels & restaurants |
139,759 |
##### |
|||
93,206 |
178,148 |
198,970 |
6.1 |
trade |
130,685 |
141,420 |
|||
6,163 |
12,317 |
14,452 |
6.2 |
hotels & restaurants |
9,074 |
10,063 |
|||
51,131 |
97,704 |
113,042 |
7 |
transport, storage & communication |
73,609 |
79,073 |
|||
9,648 |
14,447 |
15,006 |
7.1 |
railways |
11,368 |
11,569 |
|||
31,429 |
61,732 |
72,728 |
7.2 |
transport by other means |
43,448 |
45,360 |
|||
634 |
1,012 |
1,104 |
7.3 |
storage |
675 |
706 |
|||
9,420 |
20,513 |
24,204 |
7.4 |
communication |
18,118 |
21,438 |
|||
#### |
157,556 |
181,806 |
8 |
financing, insurance, real estate & business services |
123,121 |
##### |
|||
41,665 |
84,026 |
95,177 |
8.1 |
banking & insurance |
64,852 |
68,882 |
|||
48,419 |
73,530 |
86,629 |
8.2 |
real estate, ownership of dwellings & business services |
58,269 |
61,789 |
|||
#### |
176,140 |
220,314 |
9 |
community, social & personal services |
124,351 |
##### |
|||
43,636 |
79,886 |
100,882 |
9.1 |
public administration & defence |
56,240 |
63,072 |
|||
49,996 |
96,254 |
119,432 |
9.2 |
other services |
68,111 |
74,851 |
|||
#### |
###### |
###### |
10 |
total gross domestic product at factor cost |
1,012,816 |
##### |
|||
@ provisional estimates |
* quick estimates |
||||||||
STATEMENT 3.2: GROSS DOMESTIC PRODUCT AT FACTOR COST BY ECONOMIC ACTIVITY |
|||||||
(percentage change over the previous year) |
|||||||
at current prices |
at 1993-94 prices |
||||||
1997-98@ |
1998-99* |
1997-98@ |
1998-99* |
||||
6.9 |
21.1 |
1 |
agriculture, forestry & fishing |
-1.9 |
7.2 |
||
5.6 |
21.5 |
1.1 |
agriculture |
-2.2 |
7.6 |
||
4.4 |
21.8 |
1.2 |
forestry & logging |
1.8 |
2.7 |
||
38.9 |
13.6 |
1.3 |
fishing |
0.6 |
1.5 |
||
19.5 |
1.0 |
2 |
mining & quarrying |
9.0 |
-0.5 |
||
7.2 |
9.0 |
3 |
manufacturing |
4.0 |
3.6 |
||
5.6 |
9.1 |
3.1 |
registered |
3.4 |
3.9 |
||
10.5 |
8.8 |
3.2 |
unregistered |
5.3 |
3.2 |
||
12.2 |
13.3 |
4 |
electricity, gas & water supply |
7.2 |
7.9 |
||
23.9 |
17.6 |
5 |
construction |
10.3 |
5.7 |
||
11.4 |
12.1 |
6 |
trade, hotels & restaurants |
4.5 |
8.4 |
||
11.1 |
11.7 |
6.1 |
trade |
4.3 |
8.2 |
||
14.9 |
17.3 |
6.2 |
hotels & restaurants |
7.1 |
10.9 |
||
17.2 |
15.7 |
7 |
transport, storage & communication |
8.3 |
7.4 |
||
9.0 |
3.9 |
7.1 |
railways |
1.8 |
1.8 |
||
18.9 |
17.8 |
7.2 |
transport by other means |
6.4 |
4.4 |
||
6.4 |
9.1 |
7.3 |
storage |
0.9 |
4.6 |
||
19.3 |
18.0 |
7.4 |
communication |
18.6 |
18.3 |
||
14.1 |
15.4 |
8 |
financing, insurance, real estate & business services |
11.8 |
6.1 |
||
16.6 |
13.3 |
8.1 |
banking & insurance |
17.9 |
6.2 |
||
11.4 |
17.8 |
8.2 |
real estate, ownership of dwellings & business services |
5.7 |
6.0 |
||
20.0 |
25.1 |
9 |
community, social & personal services |
12.2 |
10.9 |
||
22.6 |
26.3 |
9.1 |
public administration & defence |
14.5 |
12.1 |
||
17.9 |
24.1 |
9.2 |
other services |
10.3 |
9.9 |
||
11.9 |
16.5 |
10 |
total gross domestic product at factor cost |
5.0 |
6.8 |
||
* quick estimates |
|||||||
STATEMENT 3.3: GROSS DOMESTIC PRODUCT AT FACTOR COST BY ECONOMIC ACTIVITY |
|||||||
(percentage distribution) |
|||||||
at current prices |
at 1993-94 prices |
||||||
1993-94 |
1997-98@ |
1998-99* |
1997-98@ |
1998-99* |
|||
30.5 |
28.0 |
29.1 |
1 |
agriculture, forestry & fishing |
26.7 |
26.8 |
|
27.9 |
25.5 |
26.6 |
1.1 |
agriculture |
24.5 |
24.7 |
|
1.4 |
1.1 |
1.1 |
1.2 |
forestry & logging |
1.2 |
1.1 |
|
1.2 |
1.4 |
1.4 |
1.3 |
fishing |
1.0 |
1.0 |
|
2.5 |
2.4 |
2.1 |
2 |
mining & quarrying |
2.5 |
2.3 |
|
16.8 |
16.6 |
15.6 |
3 |
manufacturing |
17.7 |
17.2 |
|
11.2 |
11.0 |
10.3 |
3.1 |
registered |
11.8 |
11.5 |
|
5.6 |
5.7 |
5.3 |
3.2 |
unregistered |
5.9 |
5.7 |
|
2.6 |
2.4 |
2.4 |
4 |
electricity, gas & water supply |
2.5 |
2.5 |
|
5.1 |
5.7 |
5.7 |
5 |
construction |
5.1 |
5.0 |
|
12.9 |
13.8 |
13.2 |
6 |
trade, hotels & restaurants |
13.8 |
14.0 |
|
12.1 |
12.9 |
12.3 |
6.1 |
trade |
12.9 |
13.1 |
|
0.8 |
0.9 |
0.9 |
6.2 |
hotels & restaurants |
0.9 |
0.9 |
|
6.7 |
7.1 |
7.0 |
7 |
transport, storage & communication |
7.3 |
7.3 |
|
1.2 |
1.0 |
0.9 |
7.1 |
railways |
1.1 |
1.1 |
|
4.1 |
4.5 |
4.5 |
7.2 |
transport by other means |
4.3 |
4.2 |
|
0.1 |
0.1 |
0.1 |
7.3 |
storage |
0.1 |
0.1 |
|
1.3 |
1.5 |
1.5 |
7.4 |
communication |
1.8 |
2.0 |
|
11.3 |
11.4 |
11.3 |
8 |
financing, insurance, real estate & business services |
12.2 |
12.1 |
|
5.5 |
6.1 |
5.9 |
8.1 |
banking & insurance |
6.4 |
6.4 |
|
5.8 |
5.3 |
5.4 |
8.2 |
real estate, ownership of dwellings & business services |
5.8 |
5.7 |
|
11.6 |
12.7 |
13.7 |
9 |
community, social & personal services |
12.3 |
12.7 |
|
5.3 |
5.8 |
6.3 |
9.1 |
public administration & defence |
5.6 |
5.8 |
|
6.3 |
7.0 |
7.4 |
9.2 |
other services |
6.7 |
6.9 |
|
100 |
100 |
100 |
10 |
total gross domestic product at factor cost |
100 |
100 |
|
@ provisional estimates |
|||||||
STATEMENT 4.1: NET DOMESTIC PRODUCT AT FACTOR COST BY ECONOMIC ACTIVITY |
||||||
(Rs. crore) |
||||||
at current prices |
||||||
1993-94 |
1997-98@ |
1998-99* |
1997-98@ |
1998-99* |
||
229,829 |
369,120 |
449,209 |
1 |
agriculture, forestry & fishing |
257,846 |
277,004 |
210,919 |
336,598 |
411,179 |
1.1 |
agriculture |
236,869 |
255,673 |
11,166 |
14,629 |
17,861 |
1.2 |
forestry & logging |
11,749 |
12,061 |
7,744 |
17,893 |
20,169 |
1.3 |
fishing |
9,228 |
9,270 |
14,950 |
24,574 |
24,416 |
2 |
mining & quarrying |
19,120 |
19,003 |
103,739 |
182,260 |
197,579 |
3 |
manufacturing |
141,911 |
143,778 |
65,774 |
115,693 |
125,289 |
3.1 |
registered |
91,618 |
92,191 |
37,965 |
66,567 |
72,290 |
3.2 |
unregistered |
50,293 |
51,587 |
8,801 |
16,240 |
18,705 |
4 |
electricity, gas & water supply |
12,433 |
13,742 |
38,749 |
75,035 |
88,430 |
5 |
construction |
48,928 |
51,618 |
96,627 |
185,540 |
208,080 |
6 |
trade, hotels & restaurants |
135,880 |
147,376 |
91,324 |
174,787 |
174,787 |
6.1 |
trade |
128,037 |
138,617 |
5,303 |
10,753 |
12,755 |
6.2 |
hotels & restaurants |
7,843 |
8,759 |
37,721 |
75,042 |
88,515 |
7 |
transport, storage & communication |
55,708 |
60,479 |
6,792 |
10,418 |
10,785 |
7.1 |
railways |
8,146 |
8,281 |
22,888 |
47,390 |
57,410 |
7.2 |
transport by other means |
31,886 |
33,466 |
584 |
933 |
1,019 |
7.3 |
storage |
616 |
645 |
7,457 |
16,301 |
19,301 |
7.4 |
communication |
15,060 |
18,087 |
80,541 |
140,928 |
163,482 |
8 |
financing, insurance, real estate & business services |
111,040 |
117,948 |
40,110 |
79,792 |
90,392 |
8.1 |
banking & insurance |
61,498 |
65,195 |
40,431 |
61,136 |
73,090 |
8.2 |
real estate, ownership of dwellings & business services |
49,542 |
52,753 |
87,035 |
165,182 |
208,078 |
9 |
community, social & personal services |
116,552 |
129,746 |
38,760 |
71,960 |
92,074 |
9.1 |
public administration & defence |
50,726 |
57,377 |
48,275 |
93,222 |
116,004 |
9.2 |
other services |
65,826 |
72,369 |
697,992 |
1,233,921 |
1,446,494 |
10 |
total net domestic product at factor cost |
899,418 |
960,694 |
@ provisional estimates |
||||||
STATEMENT 4.2: NET DOMESTIC PRODUCT AT FACTOR COST BY ECONOMIC ACTIVITY |
||||||||
(percentage change over the previous year) |
||||||||
at current prices |
industry |
at 1993-94 prices |
||||||
1997-98@ |
1998-99* |
1995-96 |
1996-97 |
1997-98@ |
1998-99* |
|||
6.7 |
21.7 |
1 |
agriculture, forestry & fishing |
-1.0 |
10.0 |
-2.1 |
7.4 |
|
5.5 |
22.2 |
1.1 |
agriculture |
-1.3 |
10.6 |
-2.3 |
7.9 |
|
4.2 |
22.1 |
1.2 |
forestry & logging |
-0.7 |
1.3 |
1.8 |
2.7 |
|
42.1 |
12.7 |
1.3 |
fishing |
5.0 |
7.6 |
-0.5 |
0.5 |
|
25.1 |
(0.6) |
2 |
mining and quarrying |
5.7 |
0.2 |
12.4 |
-0.6 |
|
4.8 |
8.4 |
3 |
manufacturing |
14.4 |
6.2 |
1.9 |
1.3 |
|
1.9 |
8.3 |
3.1 |
registered |
15.4 |
5.8 |
0.4 |
0.6 |
|
10.5 |
8.6 |
3.2 |
unregistered |
12.4 |
6.9 |
4.9 |
2.6 |
|
13.1 |
15.2 |
4 |
electricity, gas & water supply |
8.4 |
5.4 |
9.4 |
10.5 |
|
24.3 |
17.9 |
5 |
construction |
7.0 |
2.3 |
10.2 |
5.5 |
|
11.5 |
12.1 |
6 |
trade, hotels & restaurants |
14.5 |
6.9 |
4.5 |
8.5 |
|
11.2 |
11.8 |
6.1 |
trade |
14.0 |
7.1 |
4.3 |
8.3 |
|
16.1 |
18.6 |
6.2 |
hotels & restaurants |
23.0 |
4.3 |
7.5 |
11.7 |
|
19.9 |
18.0 |
7 |
transport, storage & communication |
11.7 |
10.0 |
9.5 |
8.6 |
|
10.3 |
3.5 |
7.1 |
railways |
10.6 |
4.9 |
1.7 |
1.7 |
|
22.6 |
21.1 |
7.2 |
transport by other means |
9.1 |
8.3 |
7.2 |
5.0 |
|
6.3 |
9.2 |
7.3 |
storage |
7.2 |
-4.1 |
0.7 |
4.7 |
|
19.9 |
18.4 |
7.4 |
communication |
20.6 |
19.1 |
20.5 |
20.1 |
|
14.8 |
16.0 |
8 |
financing, insurance, real estate & business services |
7.6 |
7.3 |
12.7 |
6.2 |
|
16.8 |
13.3 |
8.1 |
banking & insurance |
10.1 |
9.4 |
18.3 |
6.0 |
|
12.3 |
19.6 |
8.2 |
real estate, ownership of dwellings & business services |
5.1 |
5.1 |
6.4 |
6.5 |
|
20.7 |
26.0 |
9 |
community, social & personal services |
8.2 |
6.3 |
12.8 |
11.3 |
|
24.1 |
28.0 |
9.1 |
public administration & defence |
7.2 |
4.3 |
16.0 |
13.1 |
|
18.2 |
24.4 |
9.2 |
other services |
8.9 |
7.9 |
10.5 |
9.9 |
|
11.9 |
17.2 |
10 |
total net domestic product at factor cost |
7.1 |
7.5 |
4.8 |
6.8 |
|
@ provisional estimates |
* quick estimates |
|||||||
STATEMENT 4.3: NET DOMESTIC PRODUCT AT FACTOR COST BY ECONOMIC ACTIVITY |
||||||
(percentage distribution) |
||||||
at current prices |
||||||
1993-94 |
1997-98@ |
1998-99* |
1997-98@ |
1998-99* |
||
32.9 |
29.9 |
31.1 |
1 |
agriculture, forestry & fishing |
28.7 |
28.8 |
30.2 |
27.3 |
28.4 |
1.1 |
agriculture |
26.3 |
26.6 |
1.6 |
1.2 |
1.2 |
1.2 |
forestry & logging |
1.3 |
1.3 |
1.1 |
1.5 |
1.4 |
1.3 |
fishing |
1.0 |
1.0 |
2.1 |
2.0 |
1.7 |
2 |
mining and quarrying |
2.1 |
2.0 |
14.9 |
14.8 |
13.7 |
3 |
manufacturing |
15.8 |
15.0 |
9.4 |
9.4 |
8.7 |
3.1 |
registered |
10.2 |
9.6 |
5.4 |
5.4 |
5.0 |
3.2 |
unregistered |
5.6 |
5.4 |
1.3 |
1.3 |
1.3 |
4 |
electricity, gas & water supply |
1.4 |
1.4 |
5.6 |
6.1 |
6.1 |
5 |
construction |
5.4 |
5.4 |
13.8 |
15.0 |
14.4 |
6 |
trade, hotels & restaurants |
15.1 |
15.3 |
13.1 |
14.2 |
13.5 |
6.1 |
trade |
14.2 |
14.4 |
0.8 |
0.9 |
0.9 |
6.2 |
hotels & restaurants |
0.9 |
0.9 |
5.4 |
6.1 |
6.1 |
7 |
transport, storage & communication |
6.2 |
6.3 |
1.0 |
0.8 |
0.7 |
7.1 |
railways |
0.9 |
0.9 |
3.3 |
3.8 |
4.0 |
7.2 |
transport by other means |
3.5 |
3.5 |
0.1 |
0.1 |
0.1 |
7.3 |
storage |
0.1 |
0.1 |
1.1 |
1.3 |
1.3 |
7.4 |
communication |
1.7 |
1.9 |
11.5 |
11.4 |
11.3 |
8 |
financing, insurance, real estate & business services |
12.3 |
12.3 |
5.7 |
6.5 |
6.2 |
8.1 |
banking & insurance |
6.8 |
6.8 |
5.8 |
5.0 |
5.1 |
8.2 |
real estate, ownership of dwellings & business services |
5.5 |
5.5 |
12.5 |
13.4 |
14.4 |
9 |
community, social & personal services |
13.0 |
13.5 |
5.6 |
5.8 |
6.4 |
9.1 |
public administration & defence |
5.6 |
6.0 |
6.9 |
7.6 |
8.0 |
9.2 |
other services |
7.3 |
7.5 |
100 |
100 |
100 |
10 |
total net domestic product at factor cost |
100 |
100 |
@ provisional estimates |
||||||
STATEMENT 5.1: PRIVATE FINAL CONSUMPTION EXPENDITURE BY OBJECT IN DOMESTIC MARKET |
|||||||
(Rs. crore) |
|||||||
at current prices |
item |
||||||
1993-94 |
1997-98@ |
1998-99* |
1997-98* |
1998-99* |
|||
315,243 |
516,143 |
598,211 |
1 |
food, beverages & tobacco |
370,803 |
385,844 |
|
290,841 |
465,258 |
538,070 |
1.1 |
food |
335,902 |
347,319 |
|
80,267 |
123,919 |
126,522 |
1.1.1 |
cereals & bread |
82,017 |
77,967 |
|
11,994 |
16,011 |
19,068 |
1.1.2 |
pulses |
11,767 |
12,959 |
|
20,162 |
28,434 |
32,641 |
1.1.3 |
sugar & gur |
22,399 |
25,011 |
|
23,204 |
33,048 |
43,877 |
1.1.4 |
oils & oilseeds |
26,572 |
29,521 |
|
62,570 |
101,160 |
131,214 |
1.1.5 |
fruits & vegetables |
75,620 |
78,494 |
|
6,209 |
9,874 |
12,087 |
1.1.6 |
potatoe & other tubers |
6,387 |
7,613 |
|
46,594 |
77,509 |
87,363 |
1.1.7 |
milk & milk products |
63,118 |
64,906 |
|
21,737 |
42,120 |
47,185 |
1.1.8 |
meat, egg & fish |
26,363 |
27,537 |
|
5,852 |
12,367 |
11,369 |
1.1.9 |
coffee, tea & cocoa |
6,051 |
5,764 |
|
12,252 |
20,816 |
26,744 |
1.1.10 |
spices & other food |
15,608 |
17,547 |
|
5,951 |
8,428 |
9,856 |
1.2 |
beverages, pan & intoxicants |
5,799 |
6,099 |
|
12,309 |
30,182 |
35,882 |
1.3 |
tobacco & its products |
20,059 |
22,397 |
|
6,142 |
12,275 |
14,403 |
1.4 |
hotels & restaurants |
9,043 |
10,029 |
|
34,999 |
59,195 |
58,686 |
2 |
clothing & footwear |
42,861 |
42,012 |
|
30,937 |
53,897 |
52,567 |
2.1 |
clothing |
38,540 |
37,216 |
|
4,062 |
5,298 |
6,119 |
2.2 |
footwear |
4,321 |
4,796 |
|
70,869 |
101,082 |
114,203 |
3 |
gross rent, fuel & power |
80,624 |
83,346 |
|
49,484 |
69,443 |
78,448 |
3.1 |
gross rent & water charges |
55,550 |
57,179 |
|
21,385 |
31,639 |
35,755 |
3.2 |
fuel & power |
25,074 |
26,167 |
|
17,610 |
29,731 |
33,357 |
4 |
furniture, furnishings, appliances & services |
23,554 |
25,211 |
|
14,239 |
23,718 |
26,154 |
4.1 |
furniture, furnishings & household equipment etc. |
19,224 |
20,591 |
|
3,371 |
6,013 |
7,203 |
4.2 |
services |
4,330 |
4,620 |
|
19,543 |
41,608 |
49,184 |
5 |
medical care & health services |
29,596 |
32,293 |
|
64,993 |
130,076 |
153,142 |
6 |
transport & communication |
99,472 |
110,362 |
|
2,294 |
4,663 |
5,412 |
6.1 |
personal transport equipment |
3,656 |
4,106 |
|
22,298 |
46,512 |
52,800 |
6.2 |
operation of personal transport equipment |
36,187 |
40,410 |
|
36,143 |
69,959 |
84,460 |
6.3 |
purchase of transport services |
51,763 |
56,512 |
|
4,258 |
8,942 |
10,470 |
6.4 |
communication |
7,866 |
9,334 |
|
17,626 |
33,212 |
39,558 |
7 |
recreation, education & cultural services |
25,830 |
27,921 |
|
10,092 |
19,302 |
24,345 |
7.1 |
education |
13,629 |
15,196 |
|
7,534 |
13,910 |
15,213 |
7.2 |
others |
12,201 |
12,725 |
|
36,519 |
66,637 |
74,999 |
8 |
miscellaneous goods & services |
50,692 |
53,365 |
|
577,402 |
977,684 |
1,121,340 |
9 |
private final consumption expenditure in |
723,432 |
760,354 |
|
domestic market |
|||||||
@ provisional estimates |
* quick estimates |
||||||
STATEMENT 5.2: PRIVATE FINAL CONSUMPTION EXPENDITURE BY OBJECT IN DOMESTIC MARKET |
|||||||
(percentage distribution) |
|||||||
at current prices |
item |
||||||
1993-94 |
1997-98@ |
1998-99* |
1997-98@ |
1998-99* |
|||
54.6 |
52.8 |
53.3 |
1 |
food, beverages & tobacco |
51.3 |
50.7 |
|
50.4 |
47.6 |
48.0 |
1.1 |
food |
46.4 |
45.7 |
|
13.9 |
12.7 |
11.3 |
1.1.1 |
cereals & bread |
11.3 |
10.3 |
|
2.1 |
1.6 |
1.7 |
1.1.2 |
pulses |
1.6 |
1.7 |
|
3.5 |
2.9 |
2.9 |
1.1.3 |
sugar & gur |
3.1 |
3.3 |
|
4.0 |
3.4 |
3.9 |
1.1.4 |
oils & oilseeds |
3.7 |
3.9 |
|
10.8 |
10.3 |
11.7 |
1.1.5 |
fruits & vegetables |
10.5 |
10.3 |
|
1.1 |
1.0 |
1.1 |
1.1.6 |
potatoe & other tubers |
0.9 |
1.0 |
|
8.1 |
7.9 |
7.8 |
1.1.7 |
milk & milk products |
8.7 |
8.5 |
|
3.8 |
4.3 |
4.2 |
1.1.8 |
meat, egg & fish |
3.6 |
3.6 |
|
1.0 |
1.3 |
1.0 |
1.1.9 |
coffee, tea & cocoa |
0.8 |
0.8 |
|
2.1 |
2.1 |
2.4 |
1.1.10 |
spices & other food |
2.2 |
2.3 |
|
1.0 |
0.9 |
0.9 |
1.2 |
beverages, pan & intoxicants |
0.8 |
0.8 |
|
2.1 |
3.1 |
3.2 |
1.3 |
tobacco & its products |
2.8 |
2.9 |
|
1.1 |
1.3 |
1.3 |
1.4 |
hotels & restaurants |
1.3 |
1.3 |
|
6.1 |
6.1 |
5.2 |
2 |
clothing & footwear |
5.9 |
5.5 |
|
5.4 |
5.5 |
4.7 |
2.1 |
clothing |
5.3 |
4.9 |
|
0.7 |
0.5 |
0.5 |
2.2 |
footwear |
0.6 |
0.6 |
|
12.3 |
10.3 |
10.2 |
3 |
gross rent, fuel & power |
11.1 |
11.0 |
|
8.6 |
7.1 |
7.0 |
3.1 |
gross rent & water charges |
7.7 |
7.5 |
|
3.7 |
3.2 |
3.2 |
3.2 |
fuel & power |
3.5 |
3.4 |
|
3.0 |
3.0 |
3.0 |
4 |
furniture, furnishings, appliances & services |
3.3 |
3.3 |
|
2.5 |
2.4 |
2.3 |
4.1 |
furniture, furnishings & household equipment etc. |
2.7 |
2.7 |
|
0.6 |
0.6 |
0.6 |
4.2 |
services |
0.6 |
0.6 |
|
3.4 |
4.3 |
4.4 |
5 |
medical care & health services |
4.1 |
4.2 |
|
11.3 |
13.3 |
13.7 |
6 |
transport & communication |
13.8 |
14.5 |
|
0.4 |
0.5 |
0.5 |
6.1 |
personal transport equipment |
0.5 |
0.5 |
|
3.9 |
4.8 |
4.7 |
6.2 |
operation of personal transport equipment |
5.0 |
5.3 |
|
6.3 |
7.2 |
7.5 |
6.3 |
purchase of transport services |
7.2 |
7.4 |
|
0.7 |
0.9 |
0.9 |
6.4 |
communication |
1.1 |
1.2 |
|
3.1 |
3.4 |
3.5 |
7 |
recreation, education & cultural services |
3.6 |
3.7 |
|
1.7 |
2.0 |
2.2 |
7.1 |
education |
1.9 |
2.0 |
|
1.3 |
1.4 |
1.4 |
7.2 |
others |
1.7 |
1.7 |
|
6.3 |
6.8 |
6.7 |
8 |
miscellaneous goods & services |
7.0 |
7.0 |
|
100 |
100 |
100 |
9 |
private final consumption expenditure in |
100 |
100 |
|
domestic market |
|||||||
@ provisional estimates |
* quick estimates |
||||||
STATEMENT 6: DOMESTIC SAVING |
||||
(at current prices) |
||||
(Rs. crore) |
||||
item |
1993-94 |
1997-98@ |
1998-99* |
|
1. gross domestic saving |
193,621 |
374,415 |
393,601 |
|
1.1 household sector |
158,310 |
288,550 |
325,456 |
|
1.1.1 financial saving |
94,738 |
157,526 |
192,261 |
|
1.1.2 saving in physical assets |
63,572 |
131,024 |
133,195 |
|
1.2 private corporate sector |
29,866 |
64,786 |
67,573 |
|
1.2.1 joint stock companies |
28,437 |
62,234 |
64,955 |
|
1.2.2 co-operative banks & societies ++ |
1,429 |
2,552 |
2,618 |
|
1.3 public sector |
5,445 |
21,079 |
572 |
|
1.3.1 public authorities |
-18,559 |
-31,363 |
-62,601 |
|
1.3.1.1 government administration $ |
-25,970 |
-40,449 |
-71,939 |
|
1.3.1.2 departmental enterprises |
7,411 |
9,086 |
9,338 |
|
1.3.2 non-departmental enterprises |
24,004 |
52,442 |
63,173 |
|
2. less consumption of fixed capital ** |
83,353 |
150,525 |
165,889 |
|
2.1 household sector |
28,941 |
50,975 |
53,663 |
|
2.2 private corporate sector |
17,028 |
38,875 |
45,610 |
|
2.3 public sector |
37,384 |
60,675 |
66,616 |
|
3. net domestic saving |
110,268 |
223,890 |
227,712 |
|
3.1 household sector (1.1-2.1) |
129,369 |
237,575 |
271,793 |
|
3.2 private corporate sector |
12,838 |
25,911 |
21,963 |
|
(1.2-2.2) |
||||
3.3 public sector (1.3-2.3) |
-31,939 |
-39,596 |
-66,044 |
|
4. net capital inflow *** |
4,791 |
22,302 |
18,088 |
|
5. finances for gross capital formation (1+4) |
198,412 |
396,717 |
411,689 |
|
@ provisional estimates |
||||
* quick estimates |
||||
** Estimated from the value of fixed capital stock and expected age of various types |
||||
of assets and differs from the provisions for depreciation as per books of accounts. |
||||
Alternative estimates of net saving/capital formation can be derived using |
||||
provision for depreciation. |
||||
*** Net capital inflow is the deficit of the nation on current account in Balance of |
||||
Payment Account excluding official transfer payments. |
||||
++ Includes quasi corporate bodies |
||||
$ Includes public services in quasi-government bodies |
||||
STATEMENT 7.1: CAPITAL FORMATION BY TYPE OF ASSETS AND BY TYPE OF INSTITUTION |
|||||||
(Rs. crore) |
|||||||
at current prices |
item |
||||||
1993-94 |
1997-98@ |
1998-99* |
1997-98@ |
1998-99* |
|||
182,619 |
353,999 |
384,518 |
1 |
gross capital formation |
266,448 |
277,897 |
|
70,834 |
101,108 |
116,162 |
1.1 |
public sector |
72,684 |
79,700 |
|
48,213 |
121,867 |
135,161 |
1.2 |
private corporate sector |
96,428 |
104,475 |
|
63,572 |
131,024 |
133,195 |
1.3 |
household sector |
97,336 |
93,722 |
|
184,293 |
343,912 |
378,008 |
2 |
gross fixed capital formation |
258,593 |
272,974 |
|
68,853 |
98,589 |
114,796 |
2.1 |
public sector |
70,743 |
78,640 |
|
36,580 |
56,776 |
67,122 |
2.1.1 |
construction |
38,457 |
42,123 |
|
32,273 |
41,813 |
47,674 |
2.1.2 |
machinery & equipment |
32,286 |
36,517 |
|
51,388 |
120,907 |
133,832 |
2.2 |
private corporate sector |
95,706 |
103,539 |
|
7,356 |
16,446 |
18,104 |
2.2.1 |
construction |
12,603 |
13,480 |
|
44,032 |
104,461 |
115,728 |
2.2.2 |
machinery & equipment |
83,103 |
90,059 |
|
64,052 |
124,416 |
129,380 |
2.3 |
household sector |
92,144 |
90,795 |
|
43,689 |
85,501 |
94,766 |
2.3.1 |
construction |
61,185 |
63,858 |
|
20,363 |
38,915 |
34,614 |
2.3.2 |
machinery & equipment |
30,959 |
26,937 |
|
-1,674 |
10,087 |
6,510 |
3 |
change in stocks |
7,855 |
4,923 |
|
1,981 |
2,519 |
1,366 |
3.1 |
public sector |
1,941 |
1,060 |
|
-3,175 |
960 |
1,329 |
3.2 |
private corporate sector |
722 |
936 |
|
-480 |
6,608 |
3,815 |
3.3 |
household sector |
5,192 |
2,927 |
|
83,353 |
150,525 |
165,889 |
4 |
less consumption of fixed capital** |
113,398 |
121,140 |
|
37,384 |
60,675 |
66,616 |
4.1 |
public sector |
44,661 |
46,292 |
|
17,028 |
38,875 |
45,610 |
4.2 |
private corporate sector |
30,848 |
35,392 |
|
28,941 |
50,975 |
53,663 |
4.3 |
household sector |
37,889 |
39,456 |
|
99,266 |
203,474 |
218,629 |
5 |
net capital formation |
153,050 |
156,757 |
|
33,450 |
40,433 |
49,546 |
5.1 |
public sector |
28,023 |
33,408 |
|
31,185 |
82,992 |
89,551 |
5.2 |
private corporate sector |
65,580 |
69,083 |
|
34,631 |
80,049 |
79,532 |
5.3 |
household sector |
59,447 |
54,266 |
|
15,793 |
42,718 |
27,171 |
6 |
errors & omissions |
32,120 |
19,621 |
|
115,059 |
246,192 |
245,800 |
7 |
net capital formation adjusted |
185,170 |
176,378 |
|
for errors & omissions |
|||||||
198,412 |
396,717 |
411,689 |
8 |
gross capital formation |
298,568 |
297,518 |
|
adjusted for errors & omissions |
|||||||
@ provisional estimates |
** See footnote on item 2, Statement 6. |
||||||
STATEMENT 7.2: GROSS CAPITAL FORMATION BY INDUSTRTY OF USE |
||||||||
(Rs. crore) |
||||||||
at current prices |
industry |
|||||||
1993-94 |
1997-98@ |
1998-99* |
1996-97 |
1997-98@ |
1998-99* |
|||
15,249 |
26,306 |
29,065 |
1 |
agriculture, forestry and fishing |
18,763 |
18,660 |
19,012 |
|
13,523 |
23,228 |
25,243 |
1.1 |
agriculture |
16,610 |
16,344 |
16,457 |
|
474 |
797 |
990 |
1.2 |
forestry & logging |
506 |
514 |
583 |
|
1,252 |
2,281 |
2,832 |
1.3 |
fishing |
1,647 |
1,802 |
1,972 |
|
6,574 |
7,513 |
8,310 |
2 |
mining & quarrying |
4,938 |
5,322 |
5,571 |
|
58,702 |
144,620 |
159,179 |
3 |
manufacturing |
107,760 |
112,170 |
123,774 |
|
41,901 |
118,166 |
133,153 |
3.1 |
registered |
82,455 |
91,620 |
104,206 |
|
16,801 |
26,454 |
26,026 |
3.2 |
unregistered |
25,305 |
20,550 |
19,568 |
|
23,170 |
31,375 |
34,991 |
4 |
electricity, gas & water supply |
22,869 |
22,184 |
24,446 |
|
2,289 |
7,362 |
6,517 |
5 |
construction |
3,246 |
5,769 |
4,954 |
|
7,655 |
13,840 |
9,227 |
6 |
trade, hotels & restaurants |
-131 |
10,652 |
7,072 |
|
5,571 |
11,098 |
6,064 |
6.1 |
trade |
-2,646 |
8,511 |
4,667 |
|
2,084 |
2,742 |
3,163 |
6.2 |
hotels & restaurants |
2,515 |
2,141 |
2,405 |
|
22,770 |
32,740 |
33,944 |
7 |
transport, storage & communication |
28,016 |
25,236 |
24,960 |
|
5,580 |
5,065 |
5,029 |
7.1 |
railways |
4,932 |
4,050 |
3,935 |
|
11,304 |
17,056 |
16,843 |
7.2 |
transport by other means |
16,595 |
13,686 |
12,993 |
|
136 |
457 |
475 |
7.3 |
storage |
-103 |
344 |
336 |
|
5,750 |
10,162 |
11,597 |
7.4 |
communication |
6,592 |
7,156 |
7,696 |
|
28,189 |
40,119 |
43,725 |
8 |
financing, insurance, real |
30,422 |
29,423 |
30,643 |
|
estate & business services |
||||||||
7,510 |
11,104 |
12,289 |
8.1 |
banking & insurance |
9,948 |
8,732 |
9,336 |
|
20,679 |
29,015 |
31,436 |
8.2 |
real estate, ownership of |
20,474 |
20,691 |
21,307 |
|
dwellings & business services |
||||||||
16,535 |
26,768 |
35,791 |
9 |
community, social & |
19,869 |
19,398 |
24,426 |
|
personal services |
||||||||
11,937 |
18,065 |
24,651 |
9.1 |
public administration & defence |
13,783 |
12,797 |
16,265 |
|
4,598 |
8,703 |
11,140 |
9.2 |
other services |
6,086 |
6,601 |
8,161 |
|
181,133 |
330,643 |
360,749 |
10 |
total gross capital formation |
235,752 |
248,814 |
264,858 |
|
by industry of use |
||||||||
198,412 |
396,717 |
411,689 |
11 |
gross capital formation |
263,883 |
298,568 |
297,518 |
|
by type of assets adjusted |
||||||||
17,279 |
66,074 |
50,940 |
12 |
difference (11-10) |
28,131 |
49,754 |
32,660 |
|
@ provisional estimates |
* quick estimates |
|||||||
STATEMENT 8: PERFORMANCE OF PUBLIC SECTOR @@ |
|||
(at current prices) |
|||
(Rs. crore) |
|||
item |
1993-94 |
1997-98@ |
1998-99* |
1. gross domestic product |
781,345 |
1,384,446 |
1,612,383 |
(item 10, statement 3.1) |
|||
1.1 public |
202,512 |
350,470 |
400,238 |
1.2 private |
578,833 |
1,033,976 |
1,212,145 |
2. gross domestic saving |
193,621 |
374,415 |
393,601 |
(item 1, statement 6) |
|||
2.1 public |
5,445 |
21,079 |
572 |
(item 1.3, statement 6) |
|||
2.2 private |
188,176 |
353,336 |
393,029 |
(item 1.1+1.2, statement 6) |
|||
3. gross capital formation** |
182,619 |
353,999 |
384,518 |
(item 1, statement 7.1) |
|||
3.1 public |
70,834 |
101,108 |
116,162 |
(item 1.1, statement 7.1) |
|||
3.2 private |
111,785 |
252,891 |
268,356 |
(item 1.2+1.3, statement 7.1) |
|||
4. final consumption expenditure |
675,127 |
1,149,206 |
1,337,696 |
4.1 public |
97,725 |
171,522 |
216,356 |
4.2 private |
577,402 |
977,684 |
1,121,340 |
(item 9, statement 5.1) |
|||
percentage share of public sector |
|||
1. gross domestic product |
25.9 |
25.3 |
24.8 |
2. gross domestic saving |
2.8 |
5.6 |
0.1 |
3. gross domestic capital formation |
38.8 |
28.6 |
30.2 |
4. final consumption expenditure |
14.5 |
14.9 |
16.2 |
@ provisional estimates * quick estimates |
** unadjusted for errors & omissions |
||
@@ includes public services in |
|||
quasi-government bodies |
|||
STATEMENT 9 |
||||
INCOME AND OUTLAY ACCOUNT OF THE ADMINISTRATIVE DEPARTMENTS |
||||
INCLUDING DEPARTMENTAL ENTERPRISES OTHER THAN RAILWAYS AND COMMUNICATION @@ |
||||
(at current prices) |
||||
(Rs. crore) |
||||
item |
1993-94 |
1997-98@ |
1998-99* |
|
A. Expenditure |
||||
1. consumption expenditure |
91,810 |
160,746 |
204,184 |
|
2. Interst on public debt |
35,783 |
64,962 |
75,420 |
|
3. subsidies |
23,251 |
39,930 |
44,125 |
|
4. current transfers |
22,641 |
41,673 |
49,718 |
|
6. net saving ** |
-36,091 |
-60,209 |
-93,815 |
|
7. total expenditure |
137,394 |
247,102 |
279,632 |
|
B. Receipts |
||||
8. income from entrepreneurship and property |
8,921 |
9,690 |
21,114 |
|
8.1 profits |
-3,073 |
-8,047 |
-8,842 |
|
8.2 interest receipts |
5,954 |
8,491 |
9,864 |
|
8.3 other property receipts |
6,040 |
9,246 |
20,092 |
|
9. direct taxes |
22,985 |
60,247 |
59,207 |
|
10. indirect taxes |
101,126 |
171,130 |
194,351 |
|
11. miscellaneous |
4,362 |
6,035 |
4,960 |
|
12. total receipts |
137,394 |
247,102 |
279,632 |
|
@ provisional estimates |
@@ does not include public services in quasi-government bodies for want of details |
|||
* quick estimates |
||||
** derived as a residual i.e. total receipts minus disbursements |
||||
STATEMENT 10 |
||||
CAPITAL FINANCE ACCOUNT OF THE ADMINISTRATIVE DEPARTMENTS |
||||
INCLUDING DEPARTMENTAL ENTERPRISES OTHER THAN RAILWAYS AND COMMUNICATION @@ |
||||
(at current prices) |
||||
(Rs. crore) |
||||
item |
1993-94 |
1997-98@ |
1998-99* |
|
Expenditure |
||||
1. change in stocks |
206 |
381 |
822 |
|
1.1 administrative departments |
125 |
3 |
806 |
|
1.2 departmental enterprises |
81 |
378 |
16 |
|
2. gross fixed capital formation |
21,525 |
32,045 |
41,408 |
|
2.1 administrative departments |
14,654 |
22,826 |
31,136 |
|
2.2 departmental enterprises |
6,871 |
9,219 |
10,272 |
|
3. net purchase of second hand |
-57 |
-278 |
-239 |
|
physical assets |
||||
3.1 administrative departments |
-184 |
-371 |
-276 |
|
3.2 departmental enterprises |
127 |
93 |
37 |
|
4. capital transfers |
7,005 |
11,436 |
17,262 |
|
4.1 to the rest of the world |
152 |
367 |
601 |
|
4.2 to other sectors |
6,853 |
11,069 |
16,661 |
|
5. total expenditure |
28,679 |
43,584 |
59,253 |
|
Receipts |
||||
6. net saving |
-36,091 |
-60,209 |
-93,815 |
|
7. consumption of fixed capital |
9,585 |
15,691 |
17,483 |
|
8. capital transferred from the rest of the world |
993 |
1,018 |
812 |
|
9. net borrowings |
83,418 |
110,989 |
132,490 |
|
9.1 domestic |
78,344 |
109,878 |
131,862 |
|
9.2 external |
5,074 |
1,111 |
628 |
|
10. other liabilities |
-29,226 |
-23,905 |
2,283 |
|
11. total receipts |
28,679 |
43,584 |
59,253 |
|
@ provisional estimates |
||||
* quick estimates |
||||
@@ does not include public services in |
||||
quasi-government bodies for |
||||
want of details |
||||
ORISSA LEGISLATIVE ELECTION - 1995
Performance At a Glance
| Election to the Legislative Assembly, 1995 |
| 1. | No. of Seats | 147 |
| 2. | No. of contestants | 1413 |
| 3. | ELECTORS | |
| MEN | WOMEN | TOTAL | ||
| i. | No. of Electors | 11588070 | 10487705 | 22075775 |
| ii | No. of Voters | 8615839 | 7639718 | 16255557 |
| iii | Polling percentage | 74.35% | 72.85% | 73.64% |
| 4. | No. of Valid Votes | 15815009 |
| 5. | Votes rejected | 439618 (2.70%) |
| 6. | No. of polling Stations | 29919 |
| 7. | Average No.of Electors per polling station | 738 |
| 8. | Performance of parties |
| PARTY | No. of candidates | Seats won | % of votes polled |
| INC | 146 | 80 | 39.08 |
| B.J.P | 144 | 9 | 7.88 |
| CPI | 21 | 1 | 1.71 |
| CPM | 11 | 0 | 0.66 |
| Janata Dal | 146 | 46 | 35.41 |
| Janata Party | 4 | 0 | 0.03 |
| SAP | 55 | 0 | 0.32 |
| NATIONAL PARTIES | 527 | 136 | 85.10 |
| JPP | 4 | 1 | 0.17 |
| BSP | 59 | 0 | 0.50 |
| FBL | 2 | 0 | 0.50 |
| JMM | 16 | 4 | 1.94 |
| STATE PARTIES | 81 | 5 | 2.62 |
| REGD.PARTIES | 123 | 0 | 1.78 |
| INDEPENDENTS | 682 | 6 | 10.51 |
| TOTAL | 1413 | 147 | 100.00 |
MANIPUR LEGISLATIVE ELECTION - 1995
Performance At a Glance
| Election to the Legislative Assembly, 1995 |
| 1. | No. of Seats | 60 |
| 2. | No. of contestants | 347 |
| 3. | ELECTORS | |
| MEN | WOMEN | TOTAL | ||
| i. | No. of Electors | 631368 | 638378 | 1269746 |
| ii | No. of Voters | 572374 | 588367 | 1160741 |
| iii | Polling percentage | 90.66% | 92.17% | 91.42% |
| 4. | No. of Valid Votes | 1145965 |
| 5. | Votes rejected | 13868 (1.19%) |
| 6. | No. of polling Stations | 1992 |
| 7. | Average No.of Electors per polling station |
| 8. | Performance of parties |
| PARTY | No. of candidates | Seats won | % of votes polled |
| INC | 60 | 22 | 28.65 |
| BJP | 20 | 1 | 3.35 |
| JD | 40 | 7 | 11.92 |
| JP | 4 | - | 0.14 |
| CPI | 23 | 2 | 5.59 |
| CPM | 2 | - | 0.20 |
| SAP | 23 | 2 | 6.19 |
| NATIONAL PARTIES | 172 | 34 | 56.04 |
| ICS | 13 | 1 | 3.91 |
| KNA | 6 | - | 0.25 |
| MPP | 55 | 18 | 23.67 |
| STATE PARTIES | 74 | 19 | 27.83 |
| REGD.PARTIES | 34 | 4 | 8.40 |
| INDEPENDENTS | 67 | 3 | 7.73 |
| TOTAL | 347 | 60 | 100.00 |
‘34’
APPLICATIONS FOR ENGINEERING SERVICES EXAMINATION, 2000 INVITED
The Union Public Service Commission have invited applications from candidates for the Examination to be held on 28 June, 2000.
Candidates should not apply to the Union Public Service Commission for application form etc. of this examination. In order to streamline processing of applications, UPSC have designed and made available for sale an electronically scannable application form common for all their examinations which can be processed in computerised machines. This application form, alongwith an information brochure containing general instructions for filling up the form, an acknowledgement card and an envelope for sending application can be purchased from any one of the designated head post offices/post offices and selected field post offices throughout the country on cash payment of Rs. 20/- (Rupees Twenty only). Candidates interested in applying for this examination must use this form only.
The last date for receipt of applications is 28 February, 2000. In the case of applications received by post/speed post from the candidates residing in Assam, Meghalaya, Arunachal Pradesh, Mizoram, Manipur, Nagaland, Tripura, Sikkim, Jammu & Kashmir, Lahaul & Spiti District and Pangi Sub-Division of Chamba District of Himachal Pradesh, Andaman & Nicobar Islands or Lakshadweep and for candidates residing abroad, the last date for receipt of applications is 06th March, 2000.
For filling up the application form, the candidates should refer to the detailed instructions given in the Commission’s advertisement published in Newspapers and employment news dated 29th January, 2000.
'37'
The Ministry of Agriculture has been able to give new thrust, informed responsiveness to the problems of farmers, giving shape to new projects and schemes and quickening the development of Government business in general.
In the wake of cyclone that hit Orissa in October’99, the Department sent a team of senior officers to assess the situation in affected districts and also coordinated and provided information with regard to sources of cattle feed, vaccines. The National Dairy Development Board (NDDB) contributed Rs. 5 crore for providing assistance and supplied cattle feed, medicines and vaccines, apart from providing the services of veterinary surgeons to treat disease cases and control outbreak by administering vaccinations to the animals.
The Department conducted the first election to the Veterinary Council of India in November’99 and the constituting of full Council was notified.
A new Central Scheme nomenclatured as "Maintenance of Dredging Vessel TSD Sinduraj" was sanctioned in November 15, 1999 for dredging of fish harbours and fish landing centres.
For pursuing Government’s strategy of doubling food production and achieving the accelerated growth of livestock and fisheries products, the Department formulated Annual Plan Proposals of Rs.385.06 crore for the financial year 2000-01 and submitted the same for approval to the Planning Commission.
The Government approved in December’99, creation of separate wholly owned private companies by NDDB to take over:
For regulating coastal aquaculture, the Cabinet in its meeting on December 21, 1999 approved the Aquaculture Authority Bill for introduction in the ensuing Budget session.
An expert group was constituted under the chairmanship of Deputy Director General, Indian Council of Agricultural Research (ICAR) on December 28, 1999 for formulating a comprehensive policy for marine fisheries.
The CCEA in its meeting on January 6, 2000 approved the scheme "Assistance to Cooperatives" with a outlay of Rs.150 crore for Ninth Plan. The scheme will be implemented on a 50:50 sharing basis with the States for rehabilitation of sick milk unions.
'24'
CANADA KEEN TO PARTICIPATE IN MULTI-PURPOSE PROJECT IN GUJARAT
CANADIAN DELEGATION CALLS ON MINISTER OF STATE FOR COMMUNICATIONS
Canada has expressed its keenness to participate in a multi-purpose project for the State of Gujarat with a view to assisting the people in rural and semi-urban areas, enabling them in education, health and supporting services such as marketing etc. This multi-purpose project which has been approved by the Telecom Commission is in partnership with the International Telecommunications Union (ITU), UNESCO and the state government of Gujarat under the overall coordination and management by the Department of Telecommunications. This was indicated when the Canadian delegation led by the Vice President of the Canadian International Development Agency (CIDA), Mr. Han Sing Tse, called on the Minister of State for Communications, Shri Tapan Sikdar here today. The Canadian side stated that they were quite keen to collaborate and support the programme for applications tailored to Indian needs like tele-education, tele-health and matters related to agriculture.
Earlier, welcoming the delegation, Shri Sikdar said that India is keen to increAse its tele-density from the present 2.4 per 100 population to 5 by 2005 and 15 by 2010. He said that rural telephony in India has to pick up and the Department is engaged in providing village public telephones in all the villages by 2002. The Minister stated that Canadian experience of expertise in this respect is welcome.
A MoU was signed between Ministry of Communications, Government of India, and Department of Industry, Government of Canada in January 1996 for enhancing and facilitating various scientific, technical and managerial relationship in the sector of Telecommunications. The cooperation is foreseen in wide range of technologies and services like rural telephony, wireless and mobile satellite services and Value Added Services, etc. and also various technologies related to optical fibre cable systems, satellite systems, ATM and other aspects of planning and operations of the telecom services. It was also visualized to exchange knowledge and information regarding regulations, according rates and tariffs.
Subsequent to follow-up of this broad umbrella of MoU, two agreements were signed on March 30, 1998 between the Minster of Finance, Government of India and Minister of Revenue, Government of Canada; one on Telecommunication framework envisaging 7.5 million Canadian Dollar contribution from CEDA and Rs.2.2 crore Indian Rupees for regulation process of standardization and spectrum management and the second agreement relates to telecommunication operations project for rural telecommunications.
‘15’
India and Canada today signed a Memorandum of Understanding for a grant assistance of C $ 5 Million towards Environment Institutional Strengthening Project in India.
The Grant Assistance of C $ 5 Million (approximately Rs. 15 Crore) is in the form of technical assistance and training to be extended over a period of six and half years by CIDA.
The objective of the Project is to enhance the capacity of Ministry of Environment and Forests to address national and global environmental issues. The project components include air emissions reduction through monitoring volatile and semi-volatile organic compounds, management of hazardous substances and introduction of applications of environmental biotechnology for the remediation of contaminated sites. The project envisages collaboration between Ministry of Environment and Forests of Government of India and Environment Canada.
The MoU was signed by Shri R.S. Sharma, Joint Secretary, Department of Economic Affairs on behalf of Government of India and Mr. Hau Sing Tse, Vice President, Asia Branch, Canadian International Development Agency (CIDA) on behalf of Government of Canada in the presence of Shri B.K. Chaturvedi, Special Secretary, Department of Economic Affairs and Mr. Peter F. Walker, High Commissioner of Canada.